Running the demo
The GitHub repository contains a directory called demo in which you will find two scripts that may help you to familiarize yourself with the usage of hswfs.
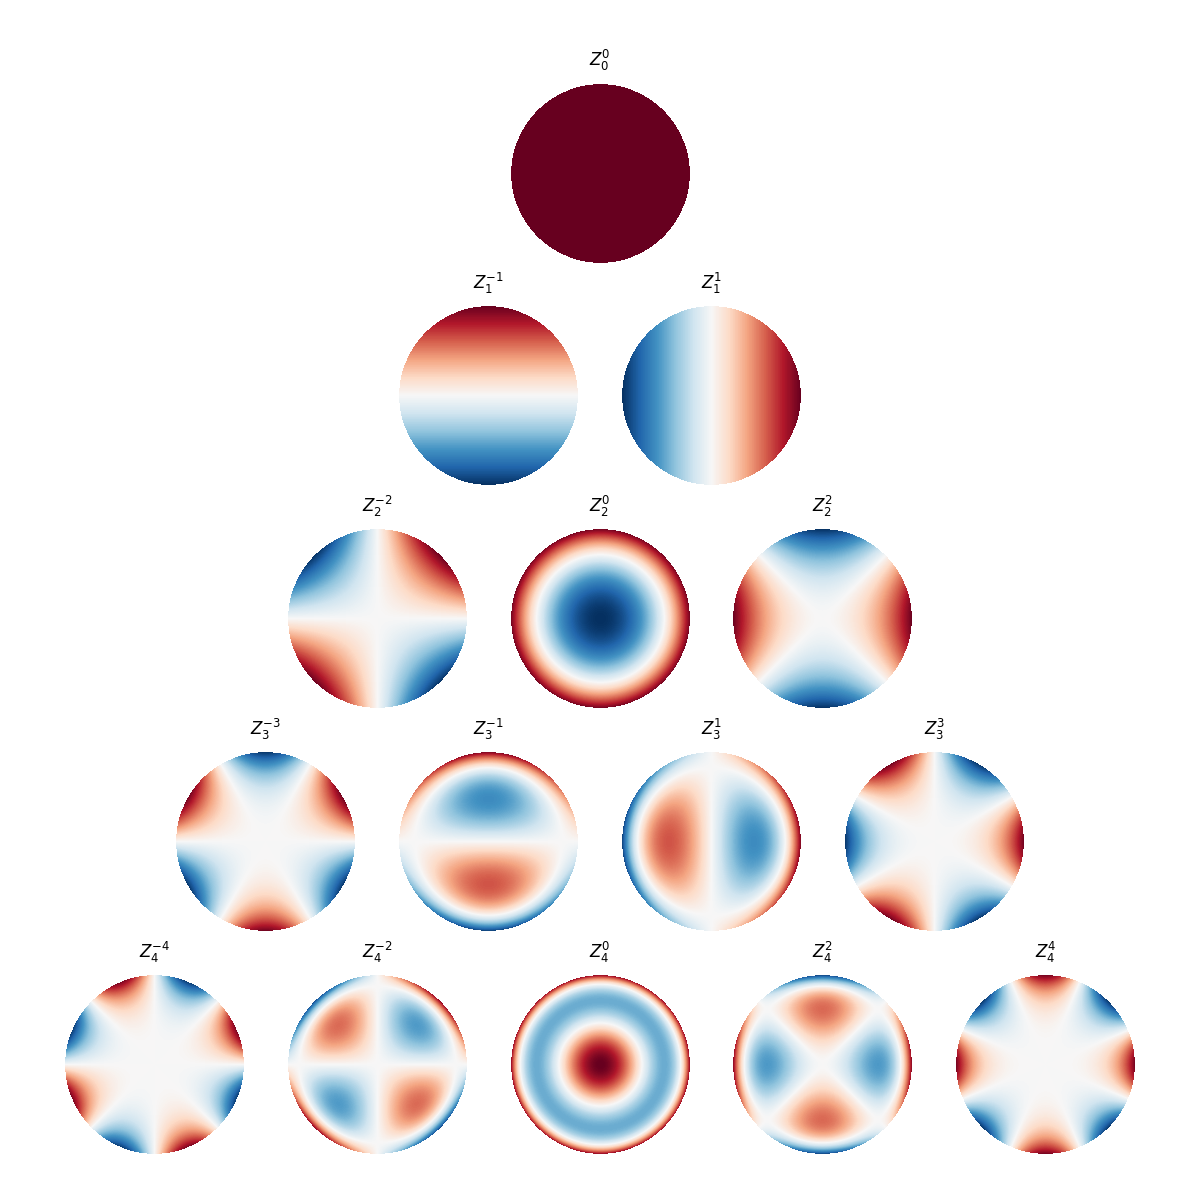
Plotting Zernike polynomials
The first script, called plot_zernike_polynomials.py, will show you how to use the hswfs.zernike.ZernikePolynomial class, and how to the hswfs.zernike.eval_cartesian() function can be used to evaluate the value of the polynomial efficiently on a grid.
If you simply run the script (it should work out of the box), it will generate the following pyramid plot of the first 15 Zernike polynomials:
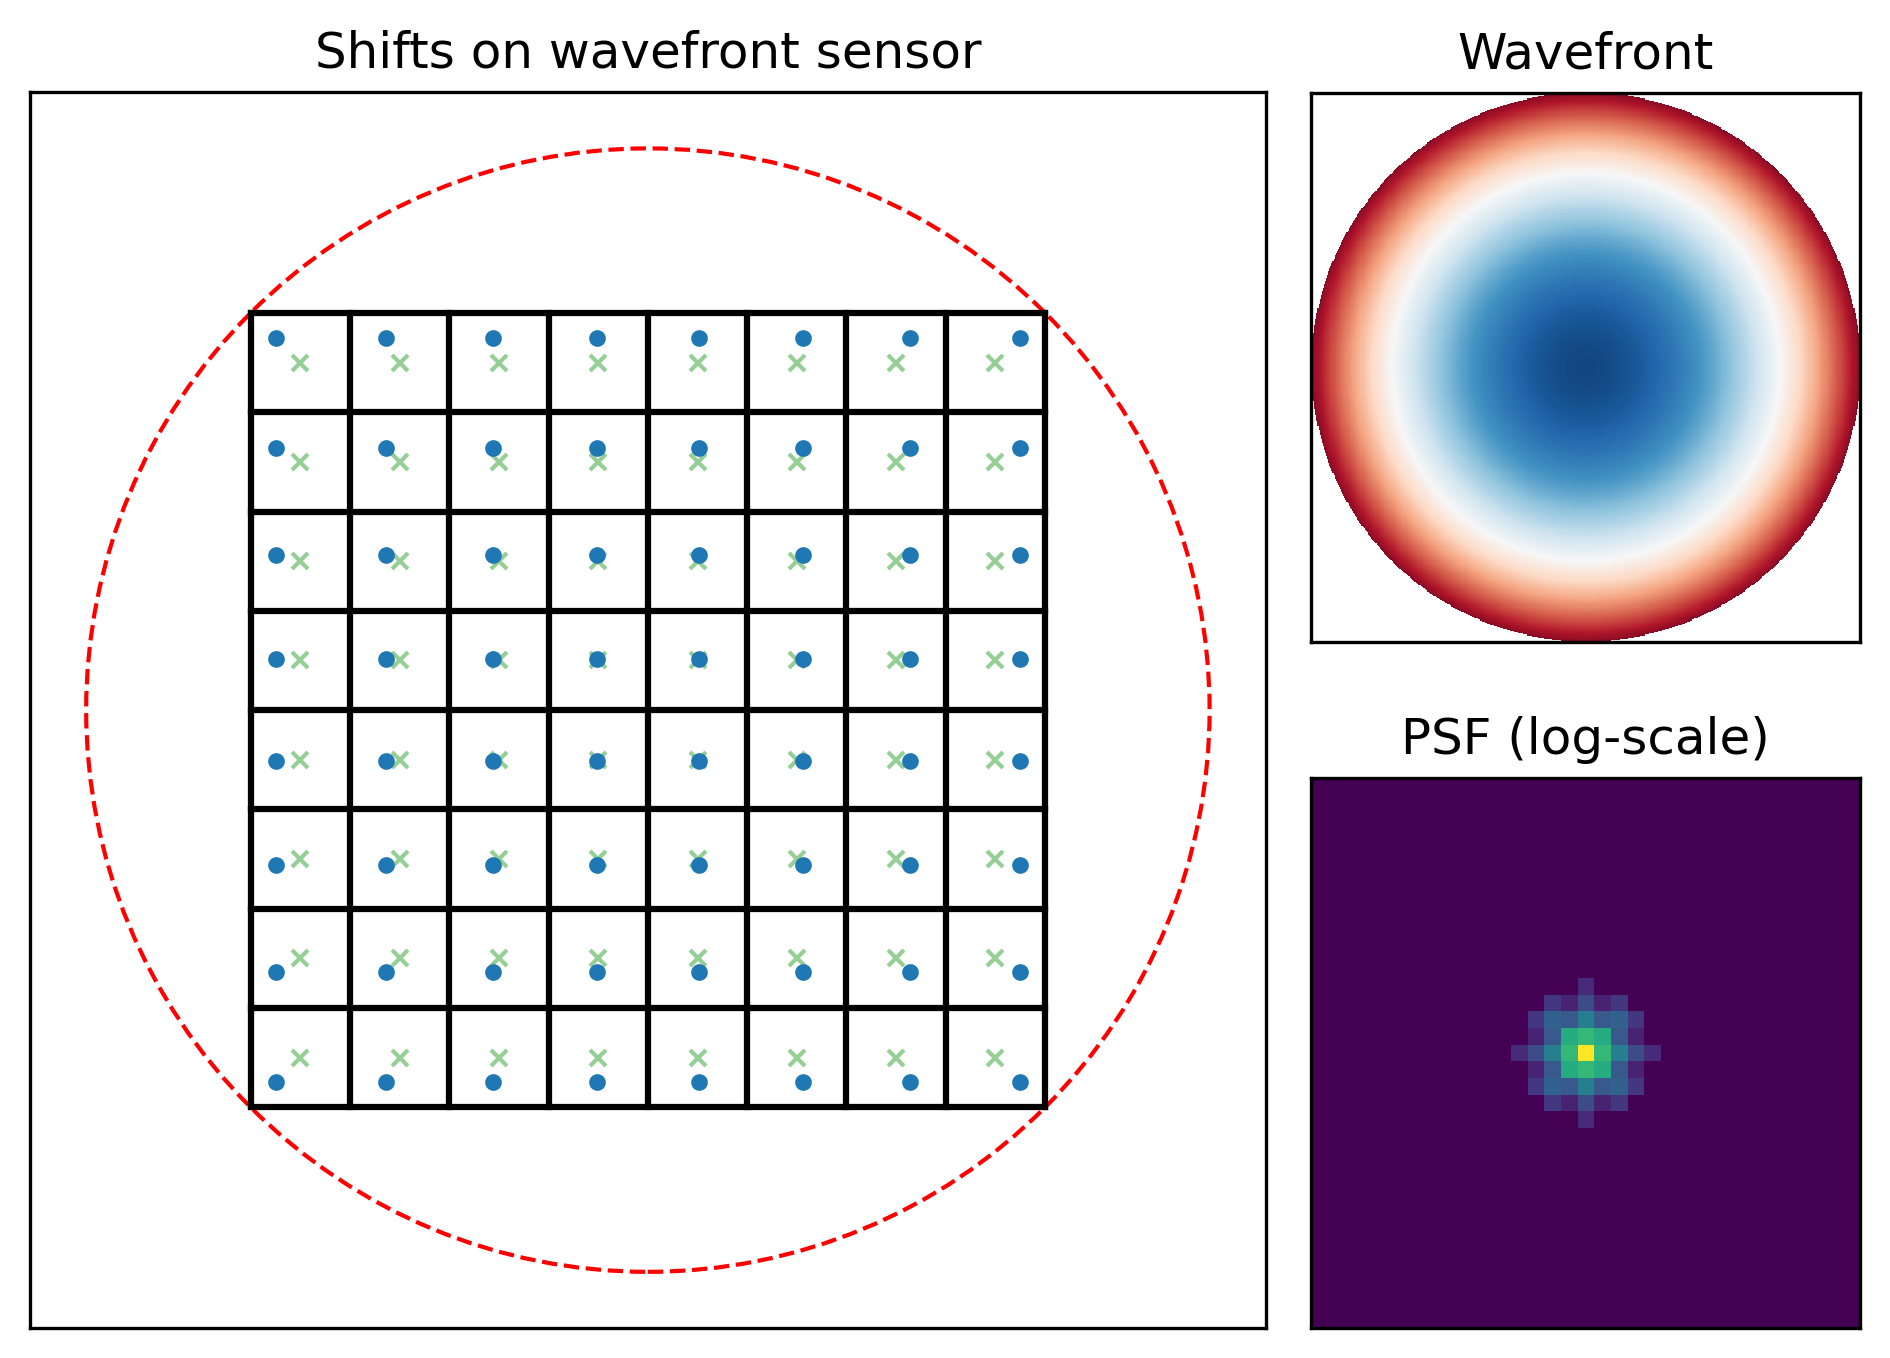
Running the wavefront sensor
The second script is called hswfs_example.py, and it will show you the basics of using the hswfs.sensor.HSWFS class.
Besides setting up a virtual wavefront sensor, it shows you how to fit a wavefront using a least squares fit, and how to compute the point spread function associated with this wavefront.
Running the script should produce the following plot: